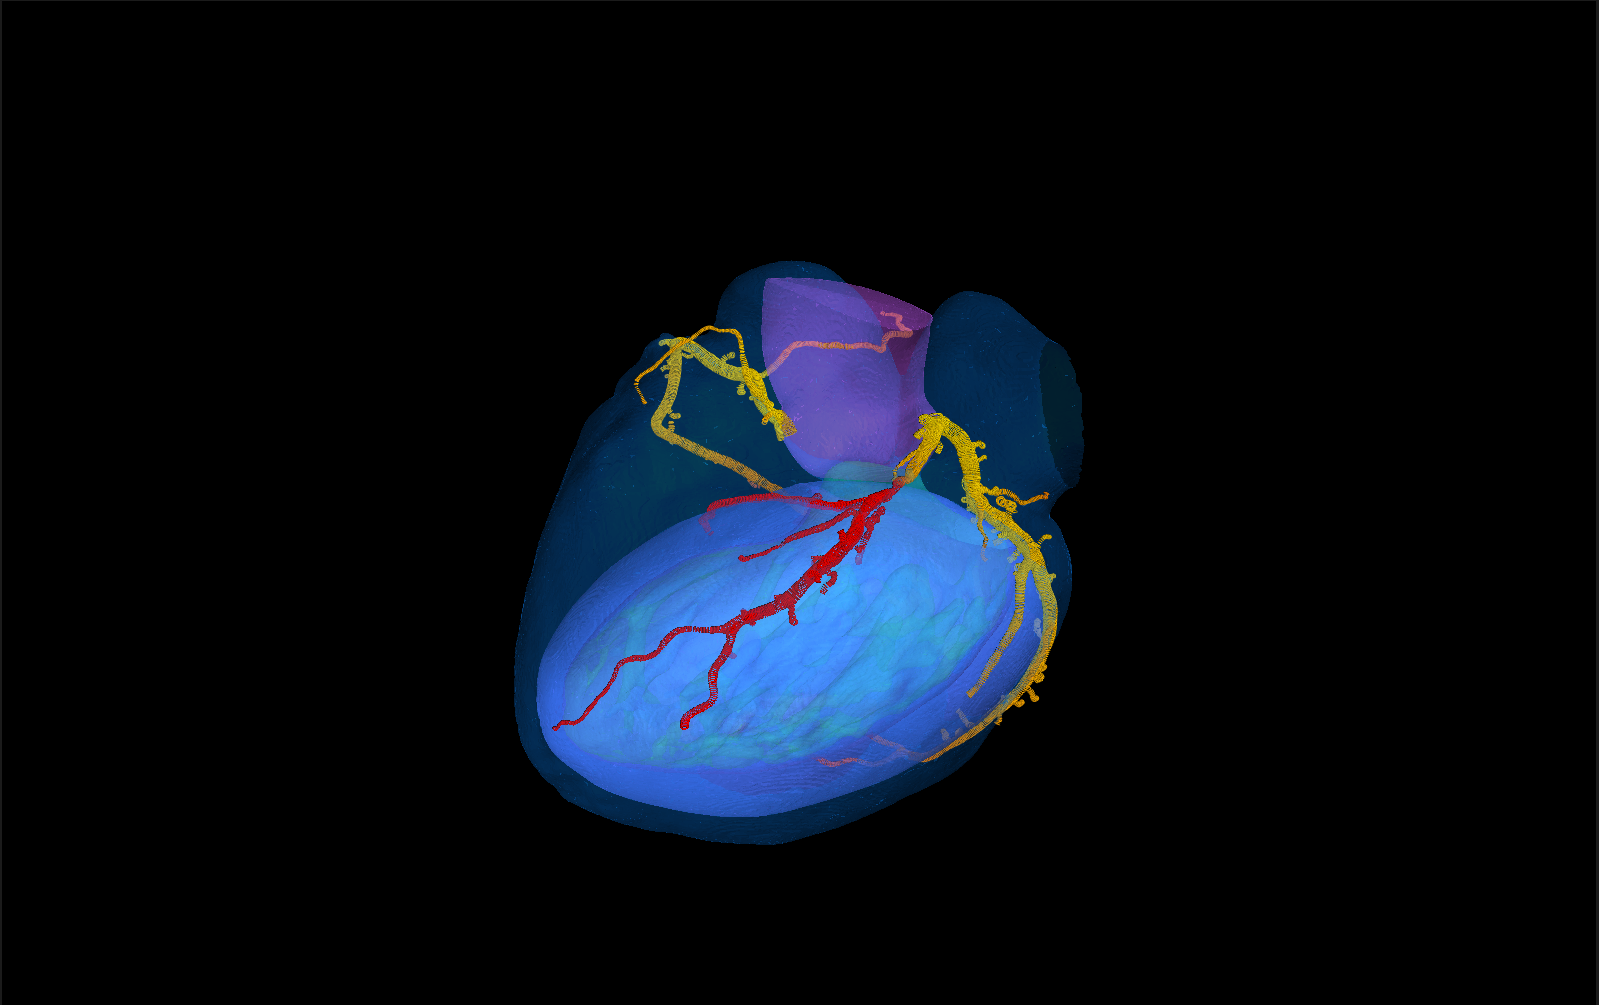
Seven validated steps, then the myocardium and the PCI plan
Each step hands an inspectable result to the next: masks, centerlines, named vessels, lumen contours, FFR values, the myocardial maps and the virtual stent. A clinician can check and correct every intermediate on screen.
Heart & coronary segmentation
Coronary lumen, aorta, LV myocardium, LV blood pool and the rest of the heart in one pass.
Dice 0.84 coronary · 0.93 LVCoronary ostia
Left and right coronary origins located on the aortic root.
0 of 42 ostia missedCenterline tracking
Network tracker trained on expert centerlines follows every branch from the ostia.
main-vessel recall 0.93Artery labelling
Tree model names LAD, CX, RCA and their side branches.
territory correct 97–99 %Lumen contours
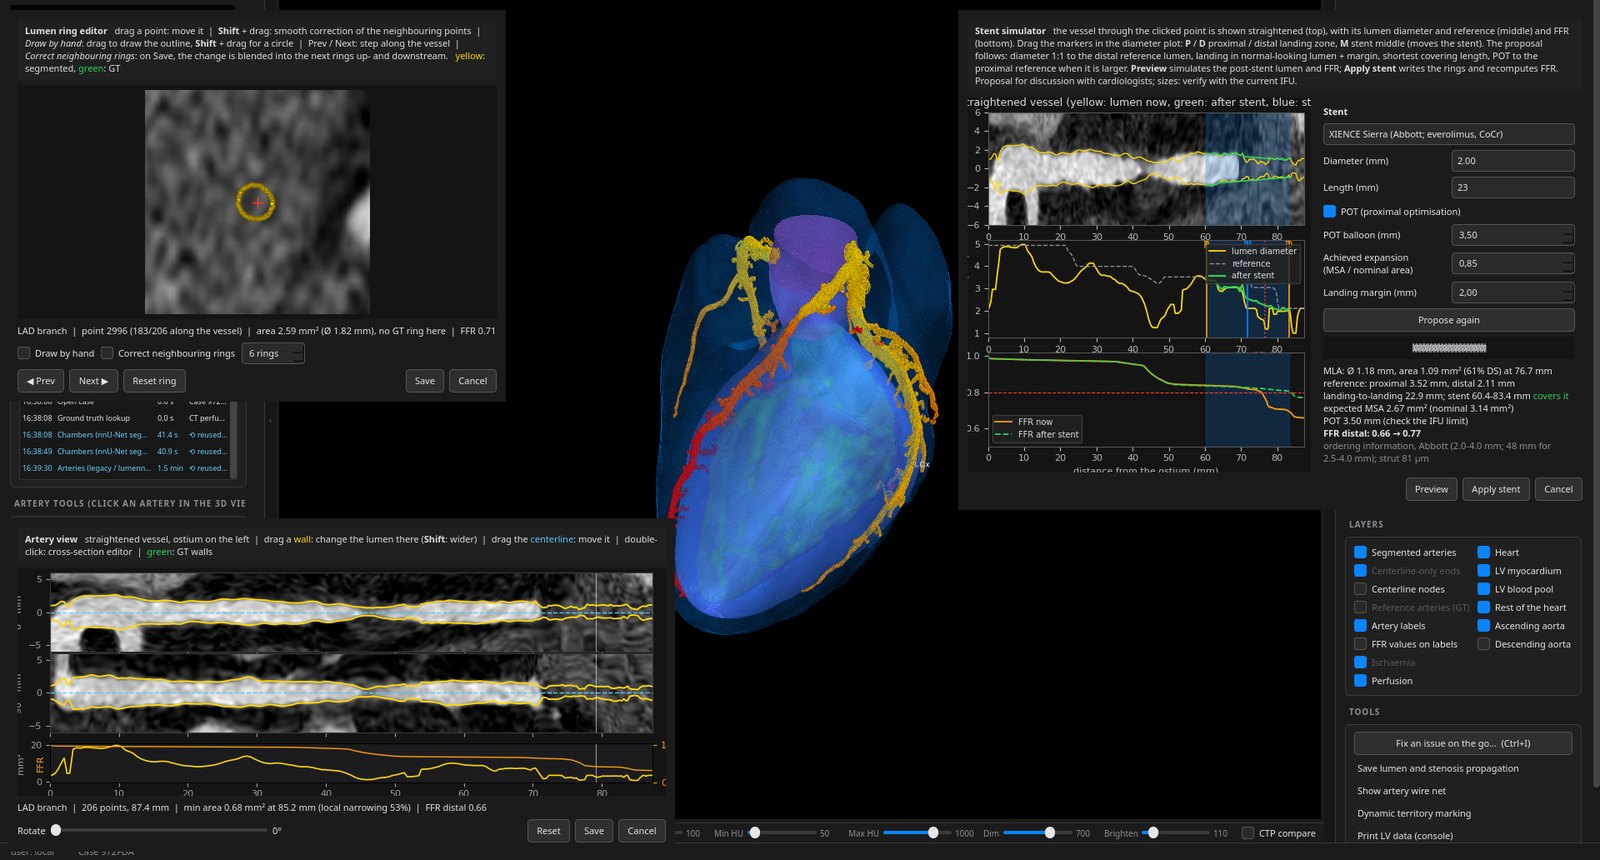
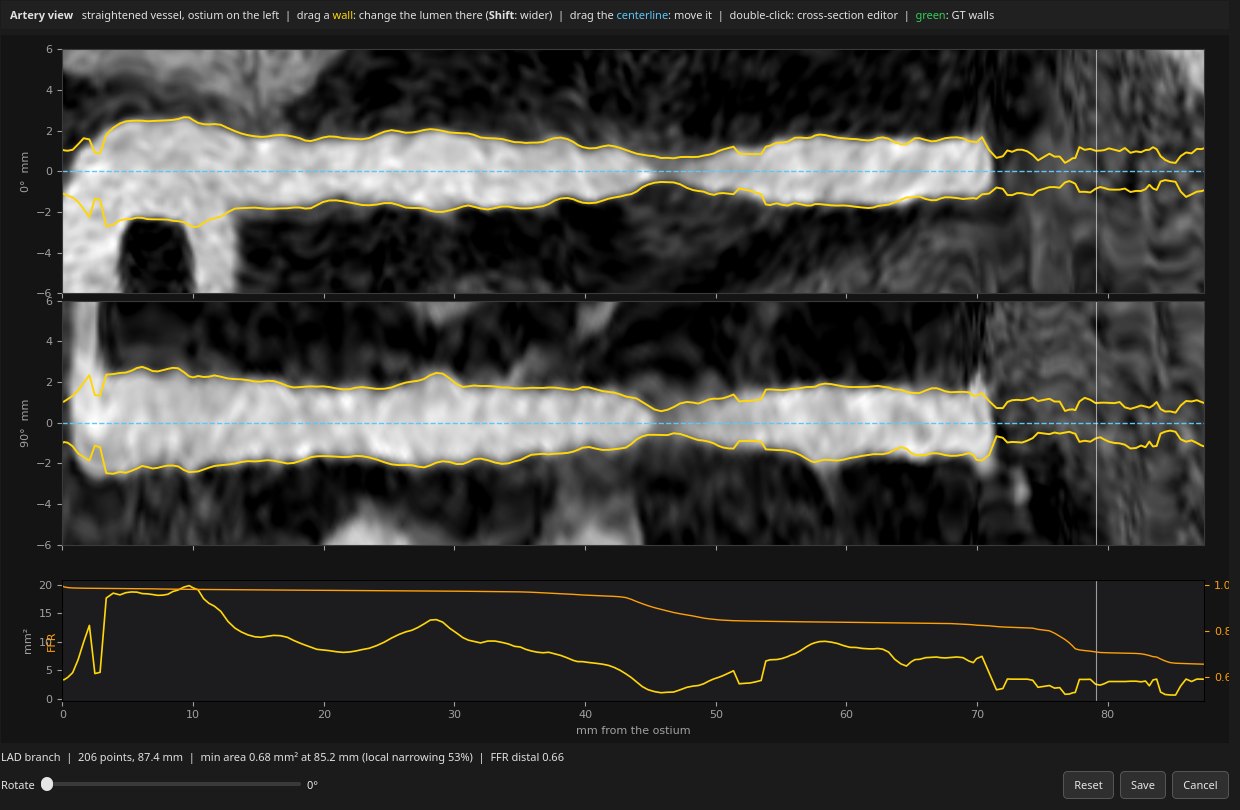
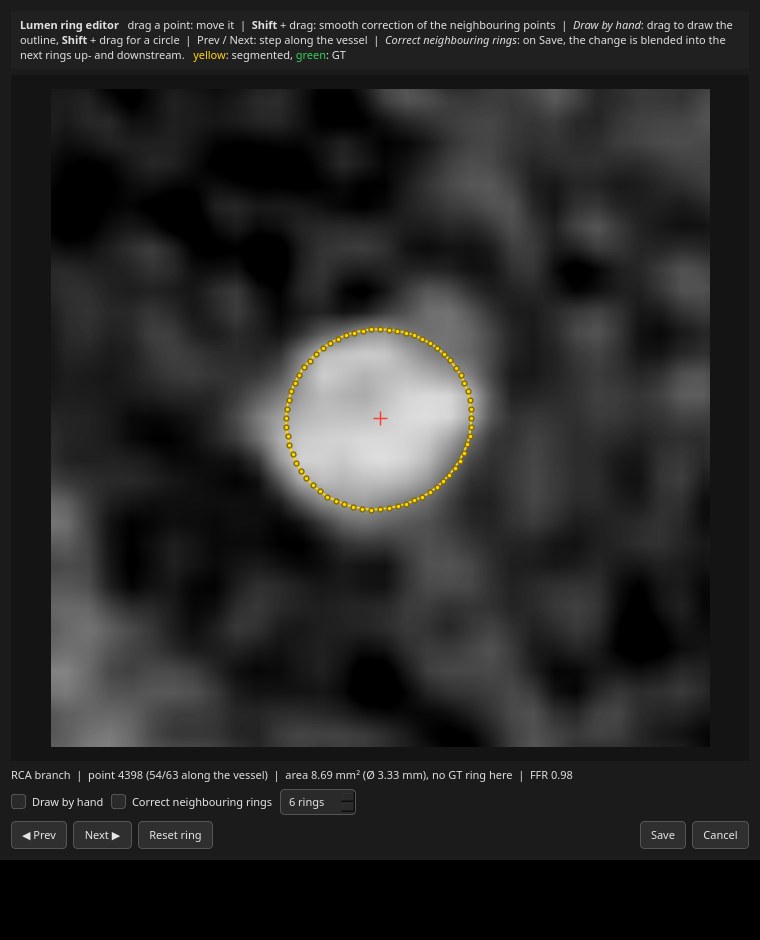
Cross-sectional lumen at every centerline point, from nine reformatted planes; editable at any point and along the straightened artery.
radius error 0.14 mmStenosis grading
Diameter stenosis read from the contours along each vessel.
specificity 0.97 at ≥ 50 %CT-FFR
Tree network, monotone along the vessel, predicts FFR at every node.
vessel accuracy 0.81–0.82Ischaemia & virtual perfusion
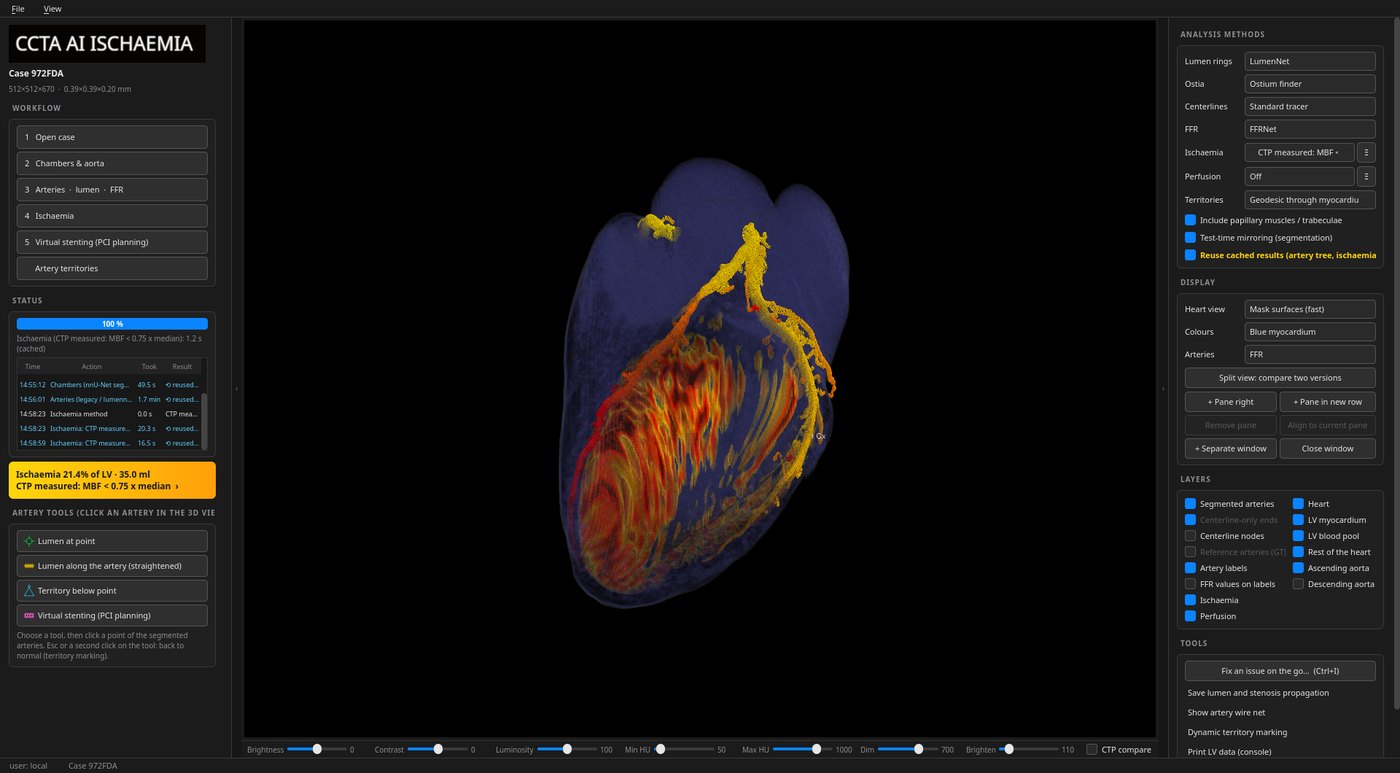
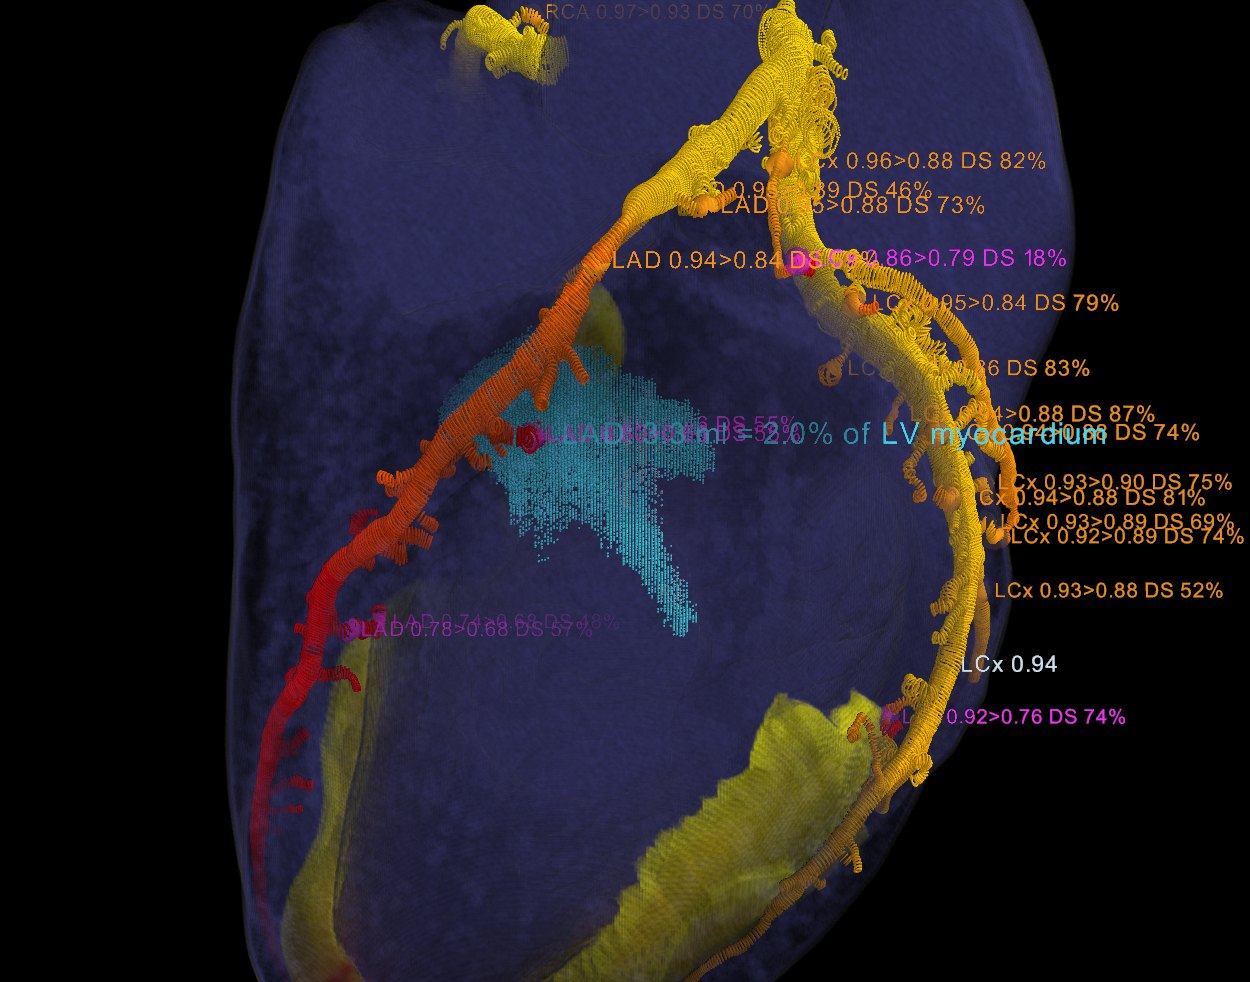
FFR, lesions, supplying territories and myocardial CT mapped onto the LV: an ischaemia map (core / penumbra, ml, % LV) and a virtual perfusion map. Trained on paired stress / rest SPECT.
territory AUC 0.885 vs SPECT (exploratory)Virtual stenting
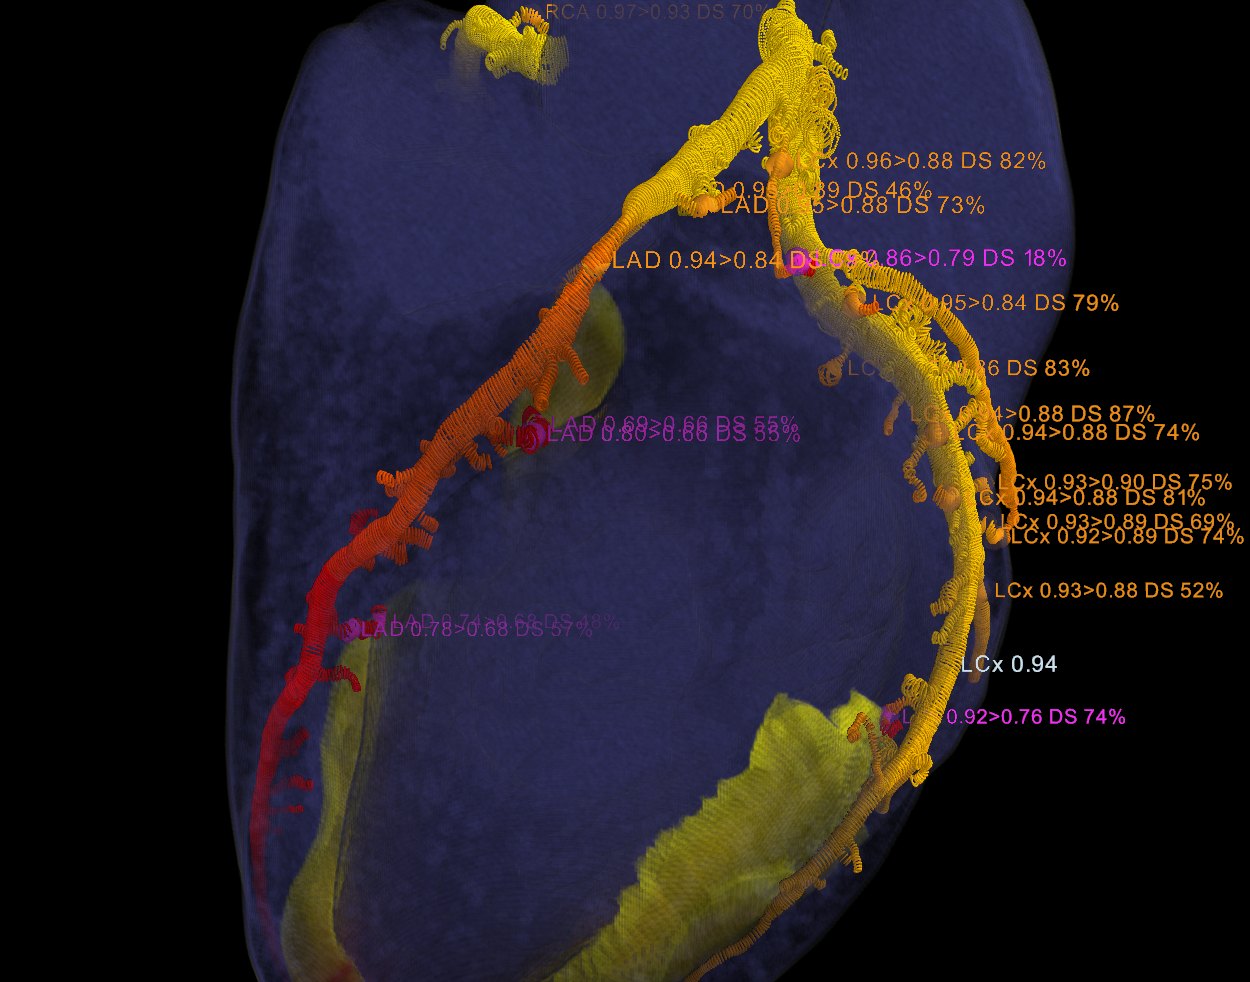
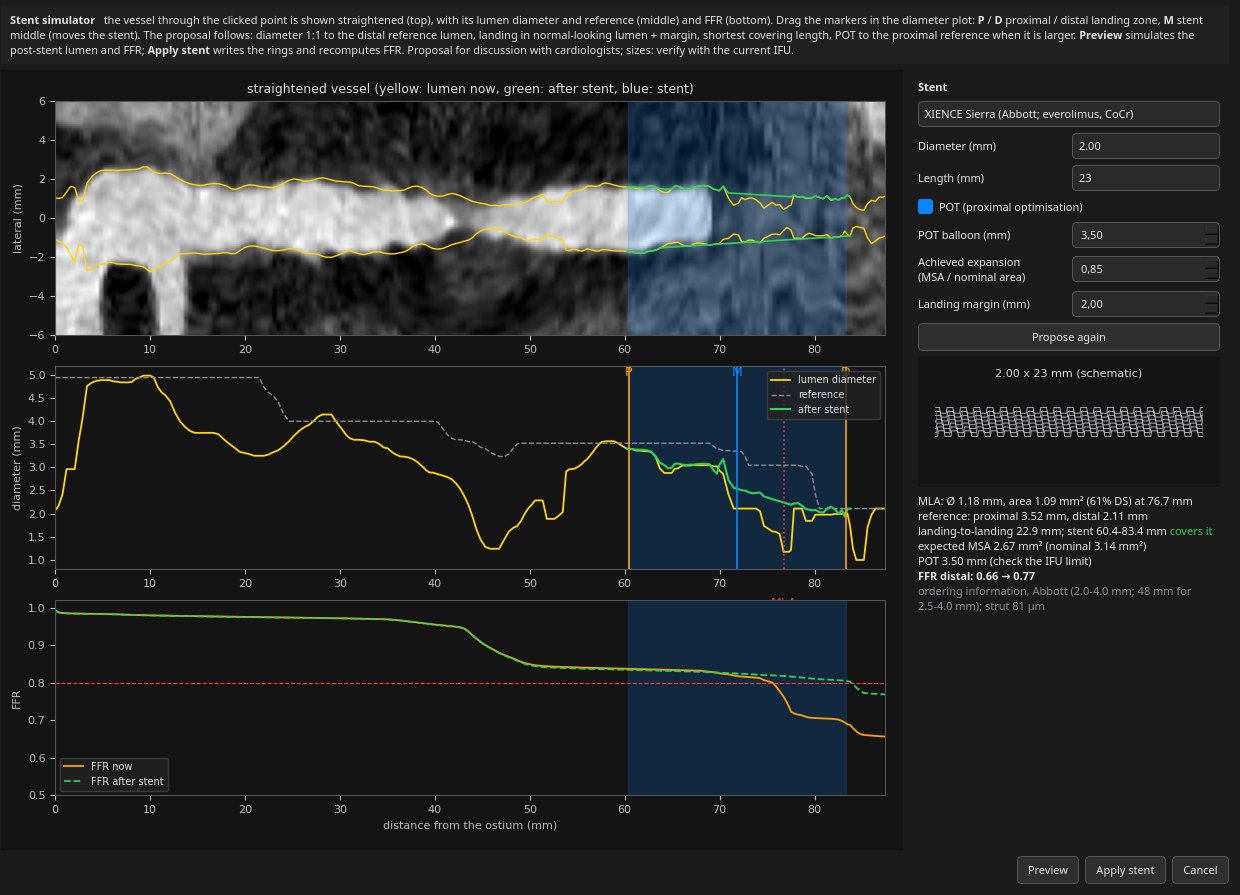
Every stenosis and FFR drop is marked; a simulated stent restores the lumen and the FFR is recomputed, before and after, for PCI planning.
FFR before → after per lesion
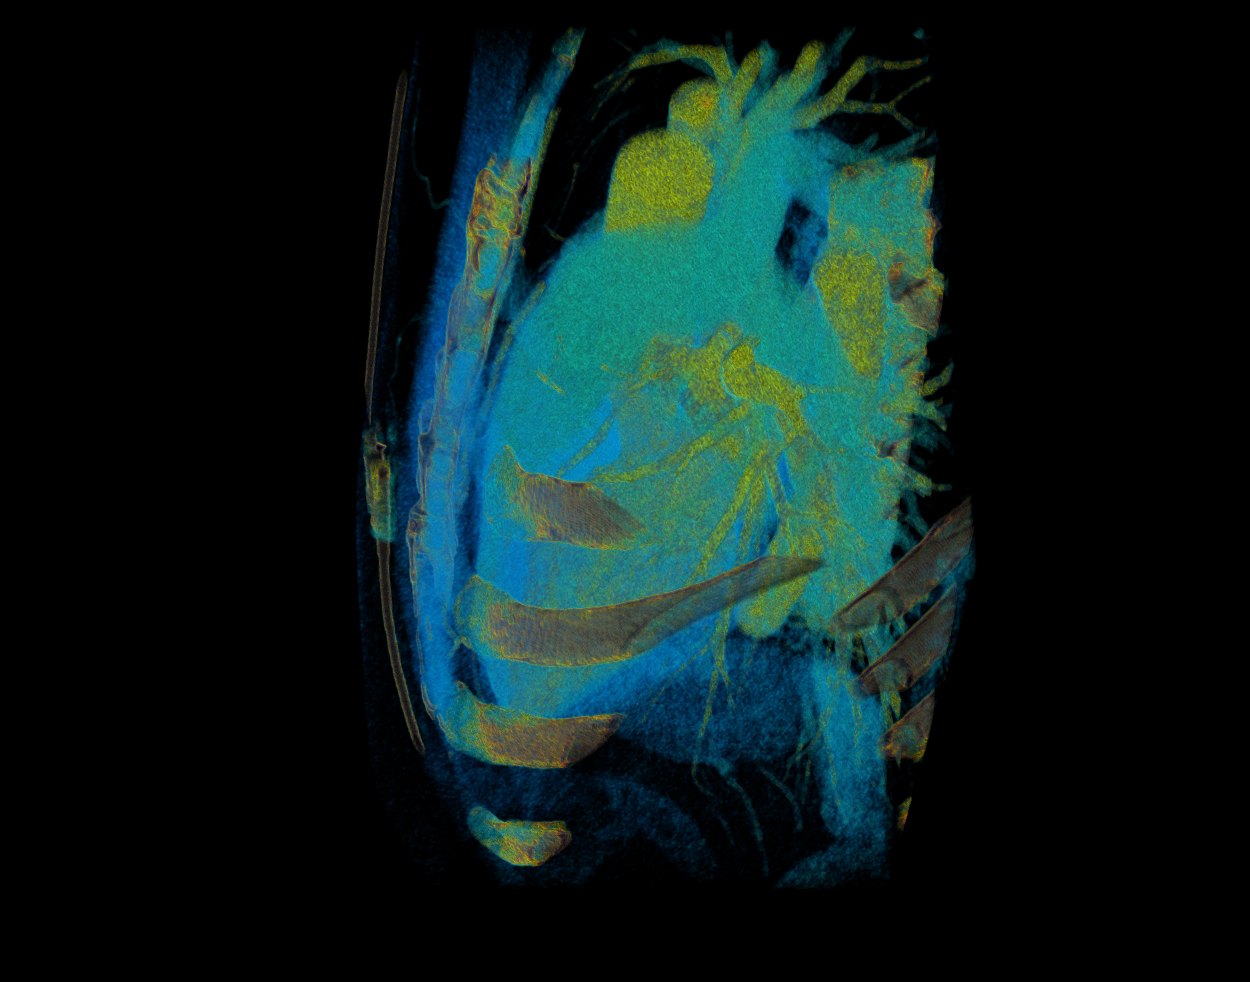
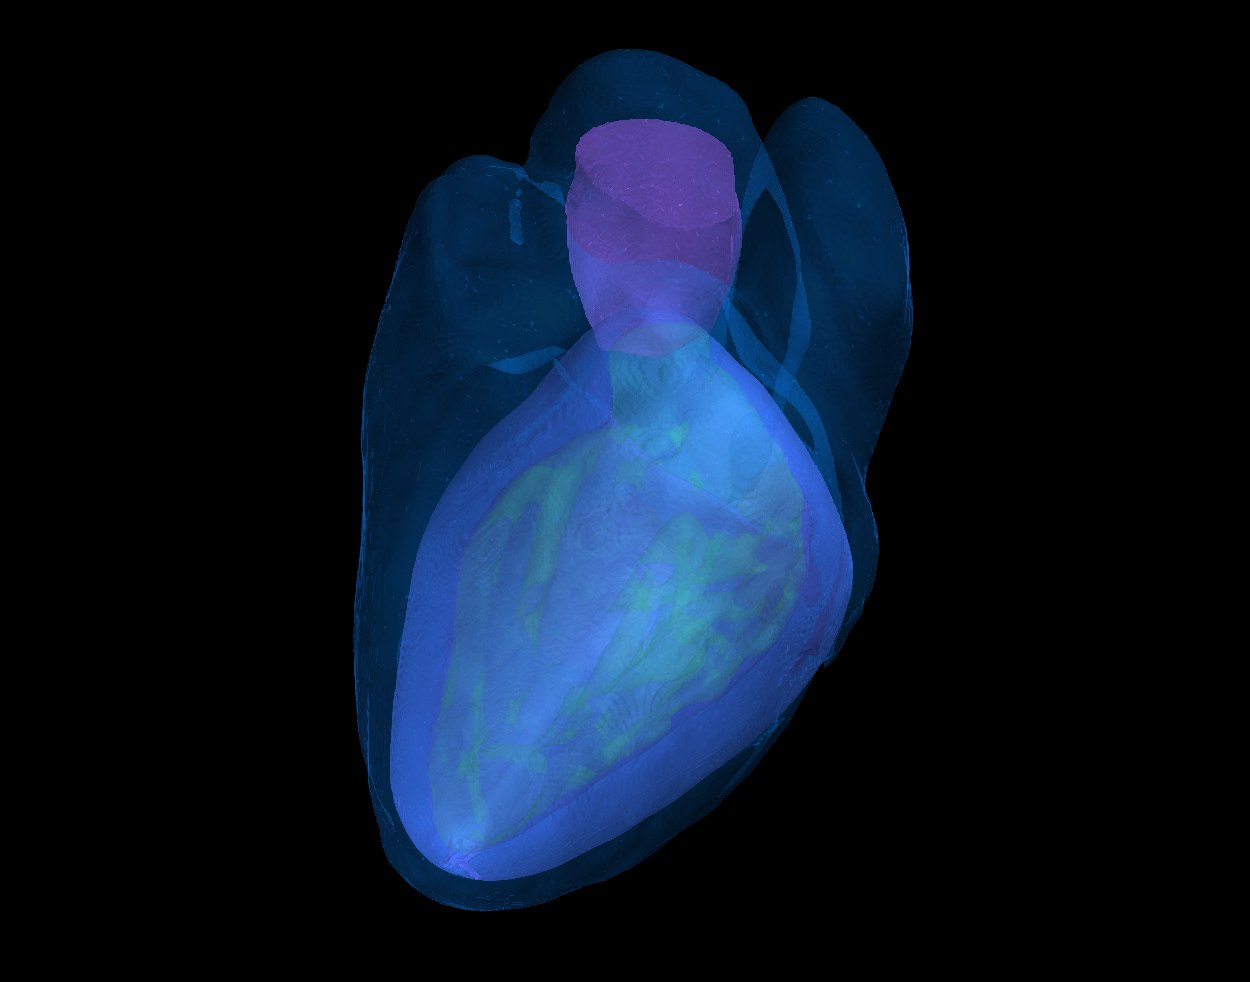
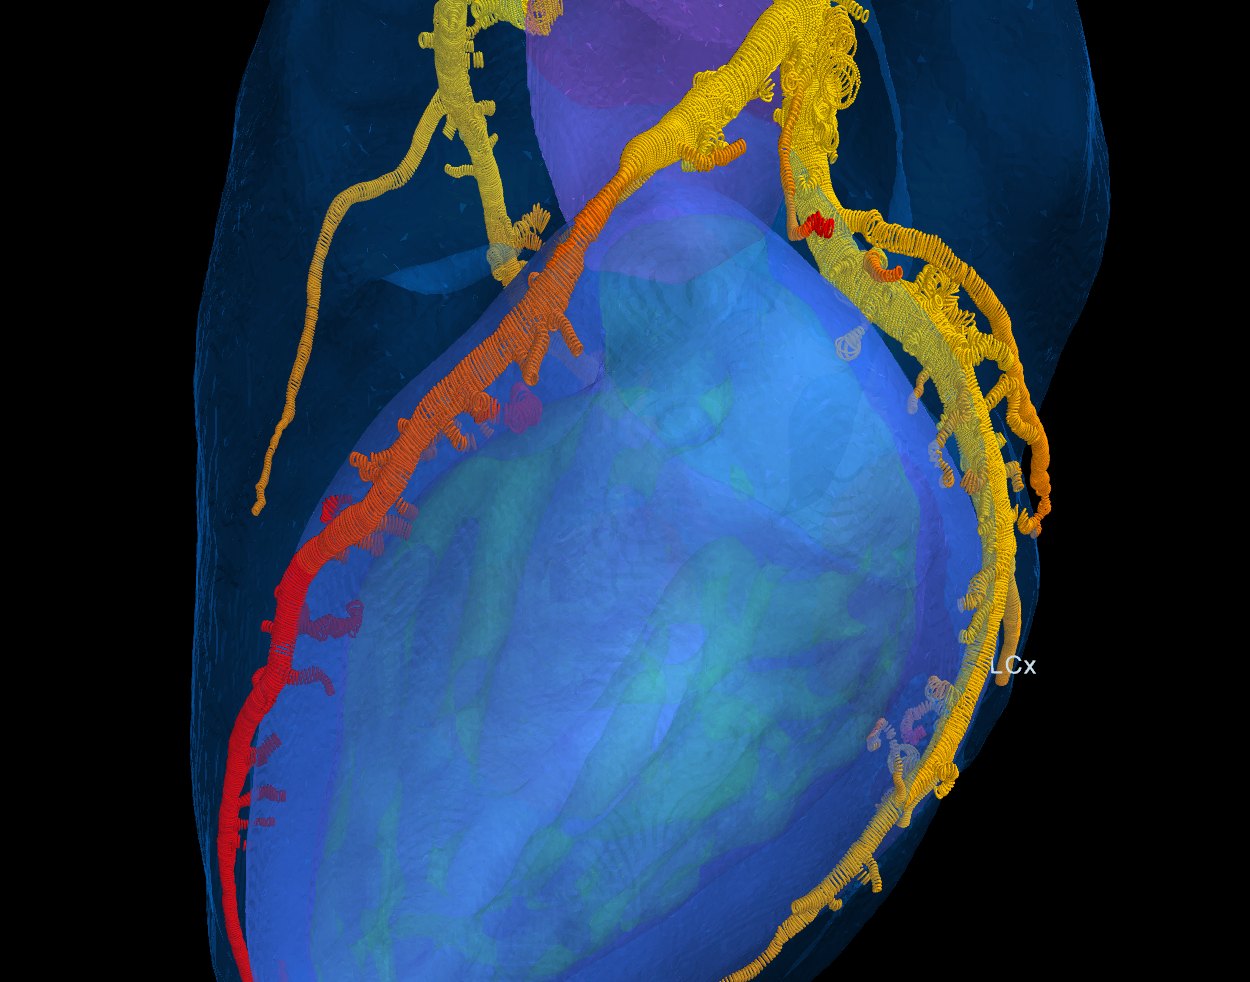
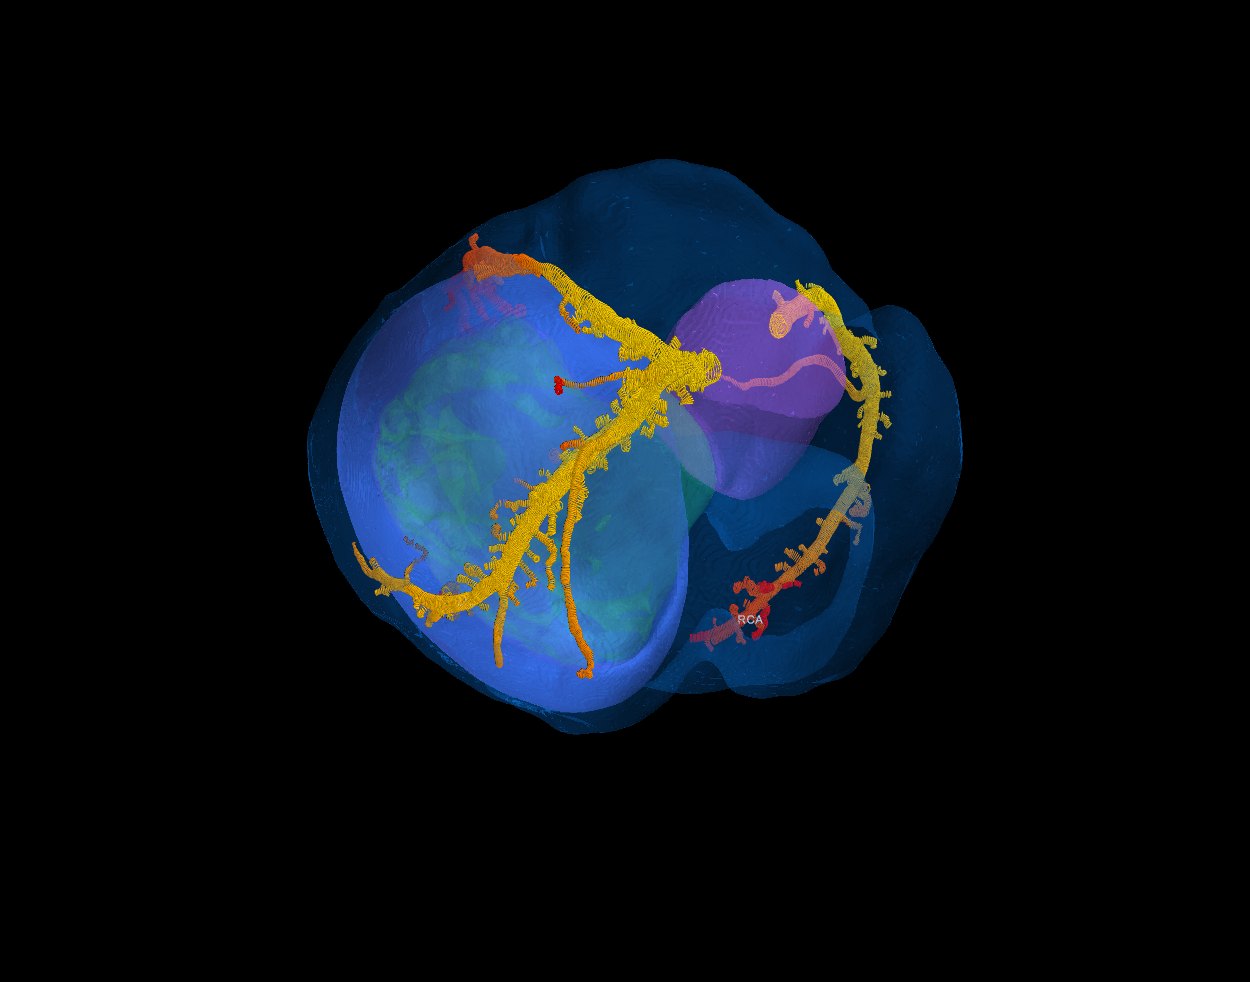
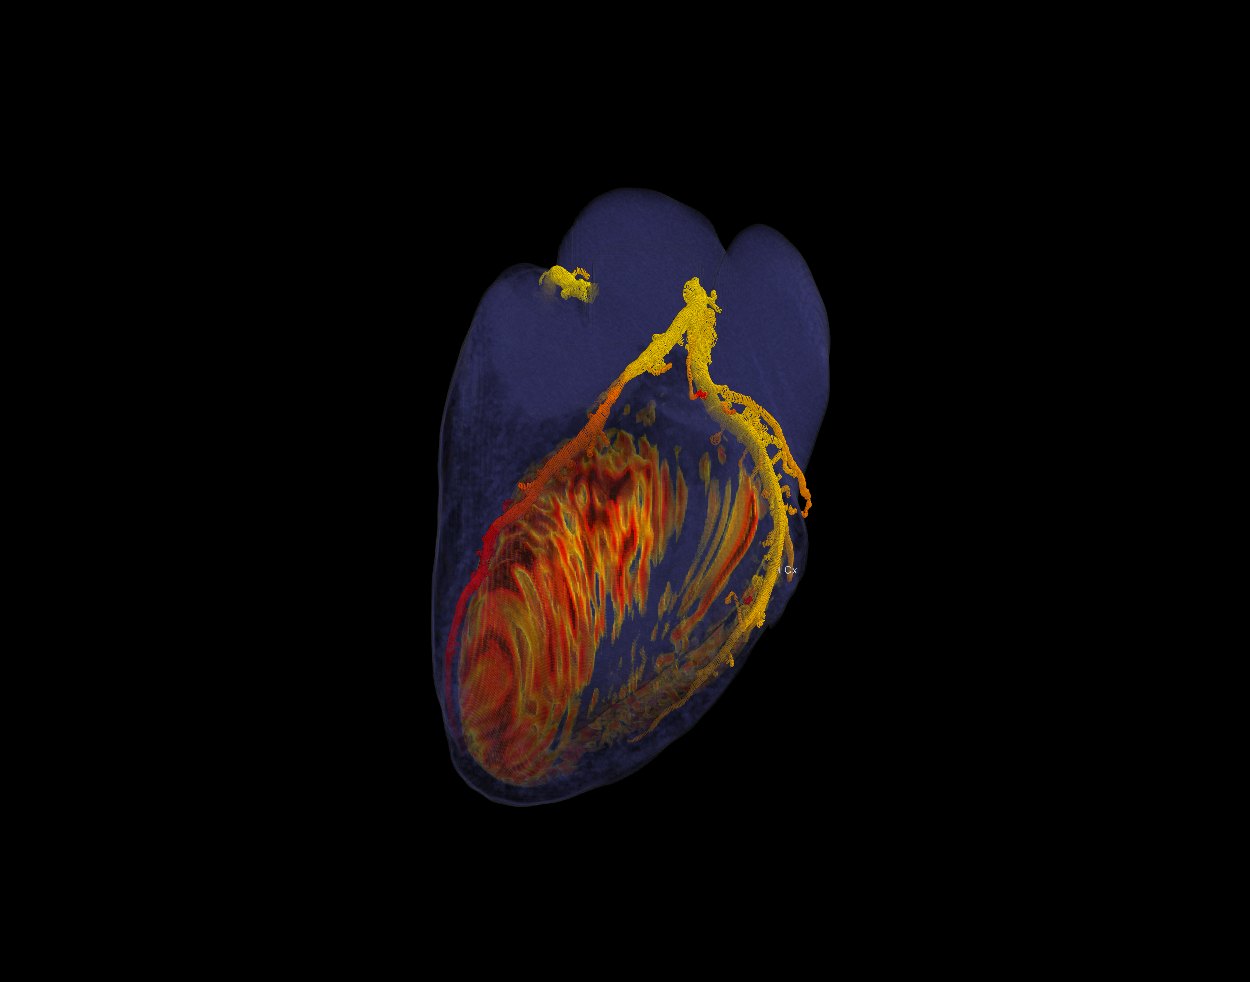
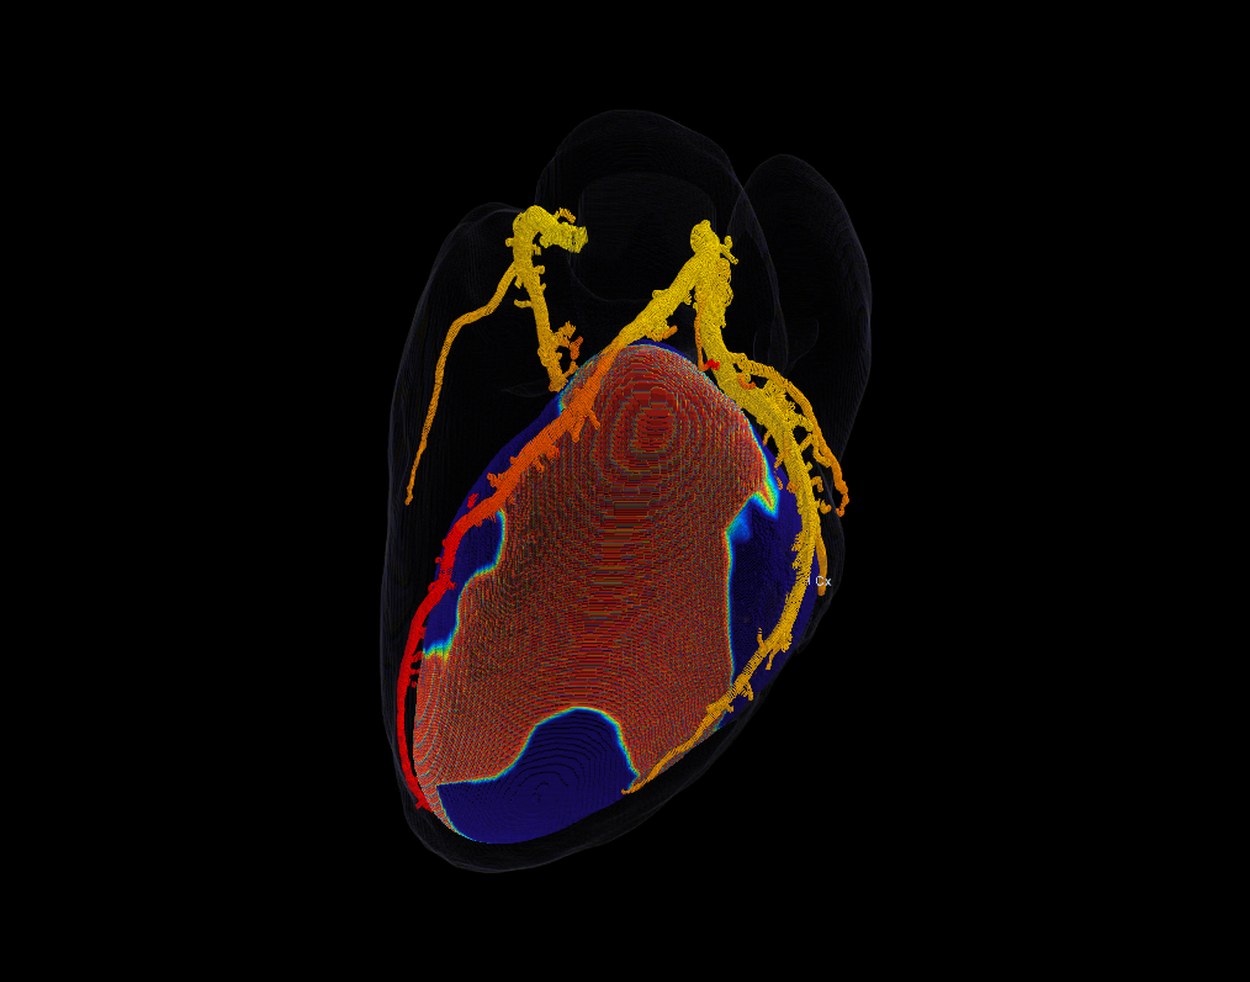
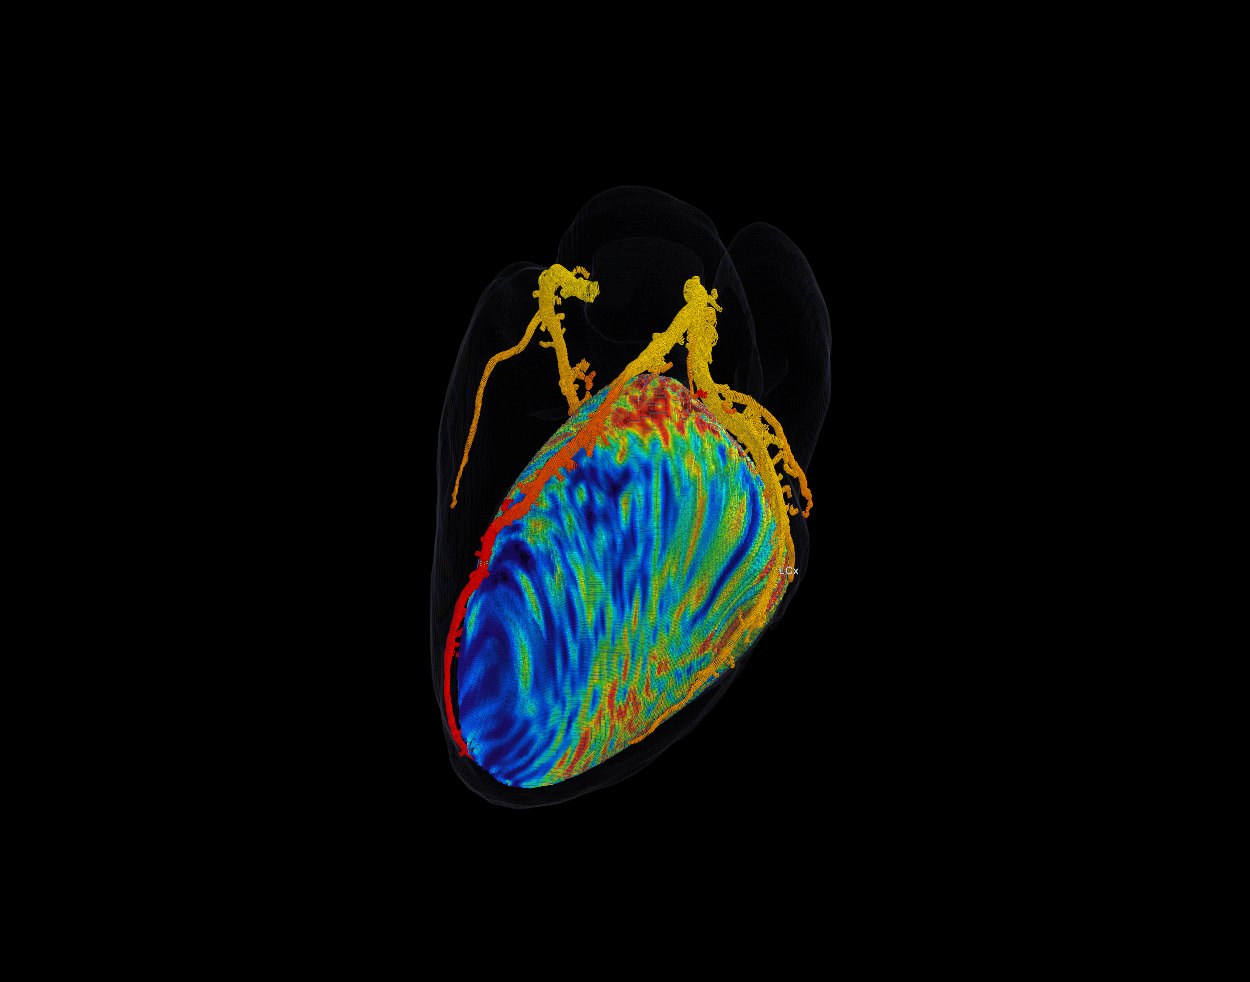
One case, every phase
A patient with a mid-LAD stenosis, followed through every phase of the software. All views and tools are the software's own screens. The ischaemia reference and the measured perfusion are this patient's own stress CT perfusion; the virtual perfusion deficit comes from the SPECT-trained model.
Held-out results: anatomy and CT-FFR
Every number below comes from a fixed test set of 21 patients that was never used for training, model selection or tuning. The reference is a full expert CT-FFR analysis: centerlines, lumen contours, marked stenoses and FFR on every node, 104,537 nodes across 129 patients in total.
Segmentation
| Metric | Result |
|---|---|
| Coronary lumen Dice | 0.841 |
| Coronary HD95 (mm) | 4.4 |
| Connectivity (clDice) | 0.833 |
| Proximal 40 mm coverage L / R | 0.96 / 0.97 |
| LV myocardium Dice | 0.930 |
| LV blood pool · aorta · heart Dice | 0.956 · 0.968 · 0.960 |
Mean over 21 patients.
CT-FFR
| Input lumen | Expert | Automatic |
|---|---|---|
| Point-wise FFR error (MAE) | 0.046 | 0.060 |
| Correlation with reference (r) | 0.91 | 0.85 |
| Lesion AUC | 0.946 | 0.865 |
| Lesion sensitivity / specificity | 0.93 / 0.65 | 0.85 / 0.75 |
| Lesion accuracy | 0.85 | 0.82 |
| Vessel AUC | 0.909 | 0.884 |
| Vessel sensitivity / specificity | 0.84 / 0.81 | 0.80 / 0.81 |
39,311 centerline points, 66 lesions (46 with FFR ≤ 0.80), 175 vessel ends. "Automatic" uses our own lumen contours.
Lumen contours and stenosis
| Metric | Result |
|---|---|
| Contour Dice | 0.858 |
| Dice inside stenoses | 0.861 |
| Radius error (mm) | 0.141 |
| Diameter-stenosis error | 0.098 |
| ≥ 50 % stenosis: specificity | 0.97 |
17,226 expert contours. Results unchanged with centerline offsets up to 0.5 mm and tilts up to 10°.
Ostia, tracking and labelling
| Metric | Result |
|---|---|
| Left ostium: median error · within 5 mm | 2.9 mm · 100 % |
| Right ostium: median error · within 10 mm | 3.6 mm · 95 % |
| Tracking recall, main vessels | 0.93 |
| RCA / LAD / CX recall | 0.94 / 0.91 / 0.90 |
| Tracking precision | 0.80 |
| Territory labelling (LAD / CX / RCA) | 0.97–0.99 |
| Left / right tree assignment | 100 % of 93 |
Tracking: 10 held-out patients, tolerance 1.5 mm, against expert centerlines.
From coronary physiology to the myocardium
The ischaemia stage predicts where the myocardium is under-perfused, from the CCTA alone. It learns in an LV-intrinsic coordinate system (apex to base, circumference, wall depth), so SPECT and other perfusion modalities train the same model. All numbers are out-of-fold: every patient is scored by models that never saw it.
Against stress / rest SPECT · Segmed
| Model (vessel-territory AUC vs reversible SPECT defect) | Primary cohort | All |
|---|---|---|
| SPECT-only network trained on the continuous rest − stress map | 0.885 | 0.84 |
| 95 % confidence interval (patient bootstrap) | 0.81–0.96 | 0.73–0.94 |
| Patients · positive territories | 118 · 5 | 176 · 6 |
Reference: reversible perfusion defect (rest − stress), corrected for the attenuation pattern of non-attenuation-corrected SPECT; AHA vessel territories. Out-of-fold, 5-fold cross-validation. Exploratory: few positive territories, validation on a larger set of reversible defects is ongoing.
Segmed data processing
| Stage | Status |
|---|---|
| Paired patients analysed (CCTA + stress / rest SPECT) | 176 |
| Automatic coronary tree, lumen and CT-FFR on the CCTA | 180 of 187 |
| SPECT polar maps, QPS-style quantification, attenuation-adjusted labels | all |
| Clinical report extraction: agreement with the reported diagnosis | 95 % |
SPECT adds stress and rest, i.e. reversibility, across three camera vendors. The analysis protocol (endpoints, cohort, models) was frozen and time-stamped before the full-set results.
Virtual perfusion
| Output | What it shows | Status |
|---|---|---|
| Virtual perfusion map | Predicted perfusion deficit (rest − stress) on the LV, from the coronary tree, FFR and myocardial CT; shown as a coloured myocardium next to the measured SPECT when a study has it. | Research preview |
| Two-phase voxel model | A bull's-eye stage learns the rest − stress difference from SPECT; a voxel stage distributes it through the wall (subendocardium to epicardium) with the area means held exactly to the bull's eye. | In development (2026) |
| Ischaemia report | Affected territories, core and penumbra in ml and % of the LV (papillary muscles optional), and a written summary. | In the software |
LLM case analysis and report generation · early stage
| Function | What it does | Status |
|---|---|---|
| Report drafting | A large language model reads the structured results of the case (culprit lesions, CT-FFR before and after each lesion, affected territories, ischaemic core and penumbra in ml and % of the LV, the method used) and drafts the ischaemia report in clinical language. Without a model connection a rule-based text is written from the same numbers. | In the software (initial version) |
| Agentic case analysis | The model works through the case like a second reader: queries measurements along the vessels, compares the ischaemia methods, checks consistency between stenosis, CT-FFR and perfusion, and flags findings that need a clinician's look. | In development |
| Clinical report understanding | The same technology turned 187 nuclear-medicine and CT reports into structured findings (walls, artefacts, stenosis per vessel) to build and check our training labels: 95 % agreement with the reported diagnosis, validated by manual review. | Used in our data pipeline |
Decision support only: every statement in a draft refers to a measured or modelled value shown on screen, and the clinician reviews and signs the report.
Paired CCTA and perfusion imaging at scale
The ischaemia stage is limited by paired data: a CCTA and a stress perfusion study of the same patient. Our main source is a multi-vendor CCTA + SPECT collection with clinical reports, complemented by research cohorts and public research datasets.
Segmed CCTA + SPECT (batch 1)
- 238
- patients in batch 1, each with coronary CT angiography and myocardial perfusion SPECT studies and their clinical reports
- 187
- with a contrast CCTA and stress and rest SPECT within one year
- 176
- analysed after technical quality control (coronary tree, LV frame)
- 118
- primary cohort: CCTA and SPECT within 90 days, no suspected revascularisation in between
- 3
- SPECT vendors (GE, ADAC / Philips, Siemens); Tc-99m, exercise and pharmacological stress
- 43 %
- abnormal perfusion by the clinical report (ischaemia or infarct)
SPECT is read into polar maps with QPS-style quantification; labels are corrected for the attenuation pattern of non-attenuation-corrected SPECT, and every NM and CT report is extracted into structured findings (walls, artefacts, stenosis per vessel), validated against the reports. The analysis protocol was frozen and time-stamped before the full-set results.
Further datasets
- Further perfusion research cohorts: used for method development under research agreements; individual studies appear as reference imagery, model results are not published from them.
- Expert CT-FFR set, 129 patients: centerlines, lumen contours, stenoses and FFR on 104,537 nodes; trains and tests the anatomy and FFR chain.
- Attenuation-corrected SPECT: partner cases with SPECT reconstructed with and without attenuation correction and raw projections, a test bed for CCTA-based attenuation correction.
- Research and challenge datasets: ImageCAS (1,000 CCTAs with coronary masks; used in lumen pre-training experiments), ASOCA (MICCAI coronary segmentation challenge) and CAT08 (Rotterdam coronary centerline challenge) for benchmarking. Research use only; not part of the product models.
Function from the scan you already have
- Lesion-specific CT-FFR at every point of the tree, so the haemodynamic relevance of each stenosis is visible next to its anatomy.
- Virtual stenting for PCI planning: stenoses and FFR drops are marked; a simulated stent shows the FFR before and after, lesion by lesion.
- Ischaemia map and report: which territory is affected, core and penumbra in ml and % of the LV, with papillary muscles in or out.
- Virtual perfusion on the myocardium, side by side with the measured SPECT when a study has one.
- LLM-drafted case report from the structured results, with an agentic second-reader analysis in development; the clinician reviews and signs.
- Territory below any point: click an artery and see the myocardium it supplies downstream.
- Lumen correction at a single cross-section or along the whole straightened artery; FFR follows the corrected lumen.
- Transparent methods: FFR rules, SPECT-trained models and the measured reference can be switched and compared, each with its data and results.
- No stress agent, no extra radiation: the analysis uses the routine CCTA only; minutes on a workstation.
Own models, own data pipeline, protected method
- Every model is our own: segmentation, ostia, tracking, labelling, lumen, FFR, ischaemia and perfusion, trained on expert-annotated data. No third-party segmentation model remains in the product.
- Strict validation: a fixed held-out test set for the anatomy and FFR chain; patient-level cross-validation and a pre-registered, time-stamped analysis protocol for ischaemia.
- Modality-independent targets: perfusion is learned in LV-intrinsic and AHA 17-segment space, so CT perfusion, SPECT and PET all add to the same model.
- Intellectual property: international patent application PCT/IB2023/059985, covering multi-stage anatomical inference, physiological territory mapping and voxel-wise ischaemia estimation.
The anatomy-to-FFR chain is built. Ischaemia now learns from paired perfusion at scale.
Every step from the raw CT to CT-FFR is trained and validated on held-out patients. The ischaemia stage is limited by paired data; with 176 CCTA + SPECT patients now analysed and further batches secured, it has the data volume to mature from a research result into a product output. Scaling to several hundred paired patients per modality, with attenuation-corrected SPECT and PET, is the direct path.
What the next round funds
- Multi-centre paired CCTA with stress perfusion (CT perfusion, SPECT, PET), building on the Segmed CCTA + SPECT collection.
- Prospective clinical validation of CT-FFR, ischaemia and virtual stenting against invasive FFR and perfusion imaging.
- MDR and FDA clearance, and the first reimbursed deployments.
We are preparing a USD 3M pre-Series A round.
Talk to us about the round